Home » Infographic
 There are lots of theories to explain why the men listed in Genesis lived so long, from the “clean environment = longevity” theory, to the “ages = clan/dynasties” theory, to “somebody added a zero/scribal error” theory. My favorite is the theory is that the ages were “sacred numbers” or symbolic somehow. The ancient Mesopotamian numbering system was based around the number 60 (most likely due to how they calculated astrological situations), which meant their highest god was assigned the ideal number, 60. Of secondary importance was the number 10, which was the number assigned to mankind (5 fingers on each hand meant a whole man = “10”). So, taking these two basic concepts, when we are told Noah was 600 when the flood came, and that he was “righteous” (or right with God) we can see that he was “10 X 60” or, 600. There’s an interesting article on this point of view here.

#OT40
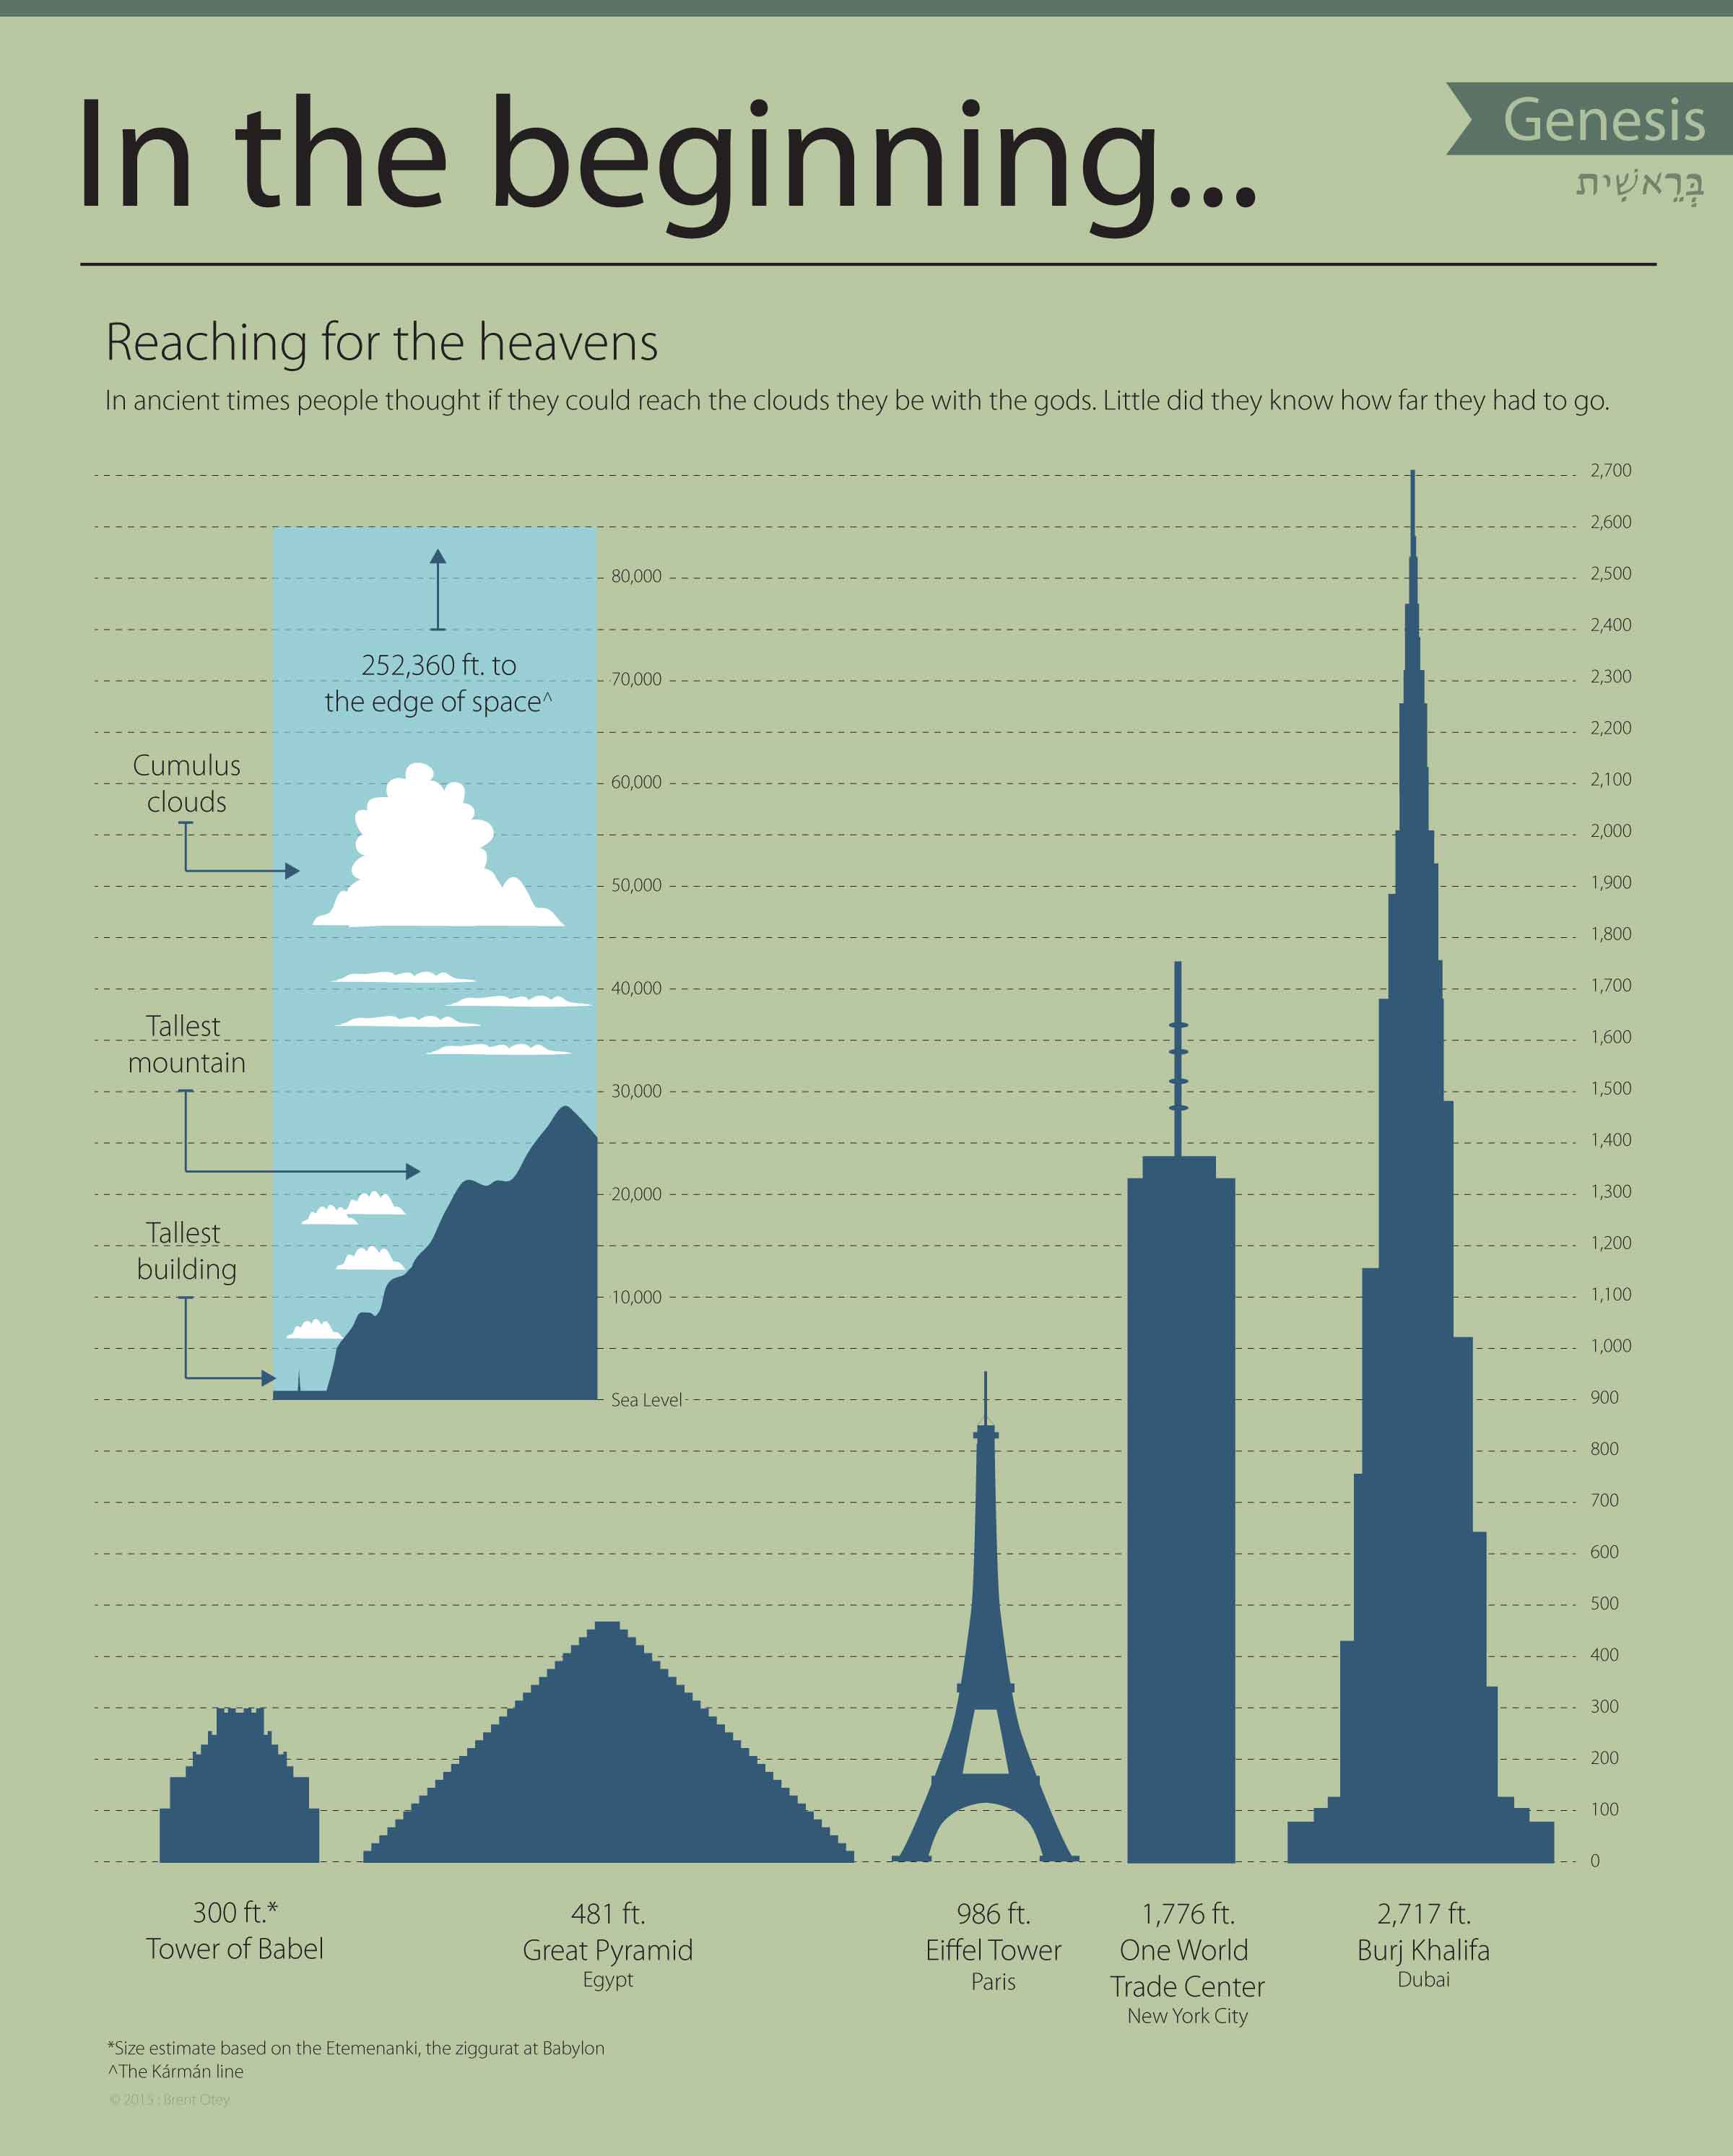
While we’re on a break from studying Mark to read through the Old Testament as a church (#OT40), I thought I’d produce a few infographics based on what we’re reading. Below is a look at the creation narrative in Genesis 1:1 – 2:3.

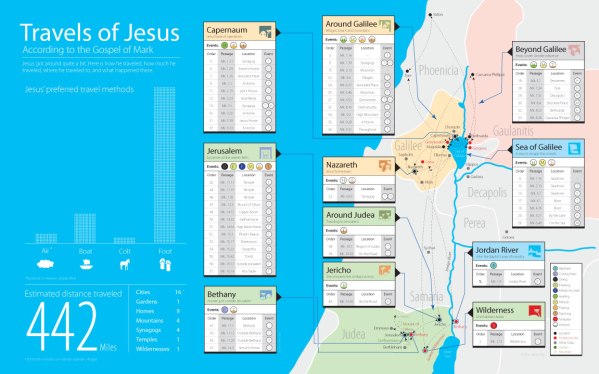
The Gospel of Mark contains a lot of information about Jesus, but its author records relatively few “actual” days in his life. Compared to how long Jesus lived (or even how many days he was in ministry) Mark accounts for very few specific days with specific instances. Below is an infographic with an overview of the days of Jesus’ life as recorded by Mark.

A Day With Jesus – Infographic (PDF)
I’ve decided to add some visuals to the information we’ve learned in the Gospel of Mark. Here is an infographic detailing the places Jesus visited and the types of events that happened there. Click on the link to see the full size version. Enjoy…